BayHaz: R Functions for Bayesian Hazard Rate Estimation
by Luca La Rocca
This is a software library for Bayesian estimation of smooth hazard rates
via Compound Poisson Process (CPP) priors;
see La Rocca (2005), which evolved in
La Rocca (2008), and my
talk at UseR! 2008.
It comes under the terms of GNU General Public License for use with R:
all software and documentation are available on
CRAN
(currently not in the Repository
but in the Archive).
When the package was available in the Repository
(I am sorry but I currently lack the energies to put it back there)
typical installation (including package coda for output diagnostics)
was via R> install.packages("BayHaz", depend = "Suggests")
Example usage is as follows:
# load package
library(BayHaz)
# set RNG seed (for example reproducibility only)
set.seed(1234)
# select a CPP prior distribution (with default number of CPP jumps)
hypars<-CPPpriorElicit(r0 = 0.1, H = 1, T00 = 50, M00 = 2, extra = 0)
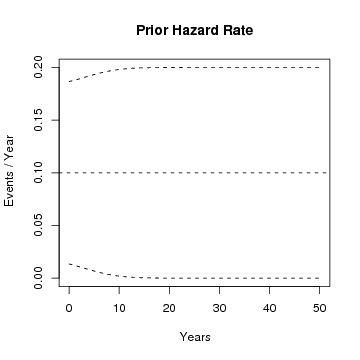
# plot pointwise prior mean hazard rate and +/- one standard deviation band
CPPplotHR(CPPpriorSample(ss = 0, hyp = hypars), tu = "Year")
# load a data set
data(earthquakes)

# generate a posterior sample
# WARNING: THIS IS TIME CONSUMING
# about 4 hours on my iBook G4
post<-CPPpostSample(hypars, times = earthquakes$ti, obs = earthquakes$ob,
                    mclen = 10000, burnin = 50000, thin = 20)

# check that no additional CPP jumps are needed
# IT IS WISE TO TRY THIS ON A SHORT RUN FIRST
# if this probability is not negligible, go back to prior selection stage and increase 'extra'
ecdf(post$sgm[,post$hyp$F])(post$hyp$T00+3*post$hyp$sd) # gives about 0.058

# take advantage of package 'coda' for output diagnostics
MCMCpost<-CPPpost2mcmc(post) # package 'coda' is automatically loaded
pdf("diagnostics.pdf")
traceplot(MCMCpost)
autocorr.plot(MCMCpost, lag.max = 5)
par(las = 2) # for better readability of the cross-correlation plot
crosscorr.plot(MCMCpost)
dev.off() # produces a non-compressed PDF file
...find here a compressed version...
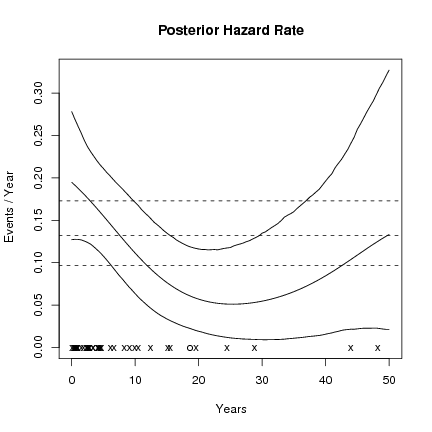
# plot some posterior hazard rate summaries
CPPplotHR(post , tu = "Year")